
Services
INTAROS develops services for multiple user segments, including science, environmental and ecosystem management, natural hazards monitoring, risk assessment and support for m itigation planning. Services combine in situ, remote sensing and model data from a multitude of providers to provide a data product that user can apply in their daily work.
Services are developed using the iAOS Cloud Platform and Jupyter Notebook. Some examples of INTAROS services are shown below.
Geostatistics for gridding in situ oceanographic data
This service was developed to generate ocean temperature and salinity fields for validation of climate model projections. Marine in situ observations are typically scattered in space and time, while models generate gridded data. The service uses geostatistic methods to interpolate a dispersed set of in situ point measurements to a regular grid, allowing comparison with model projections.
The service was applied to a 22 year long time series of CTD data held by the Norwegian Marine Data Centre. In total the input data amounted to 5.5 billion samples measured over 63
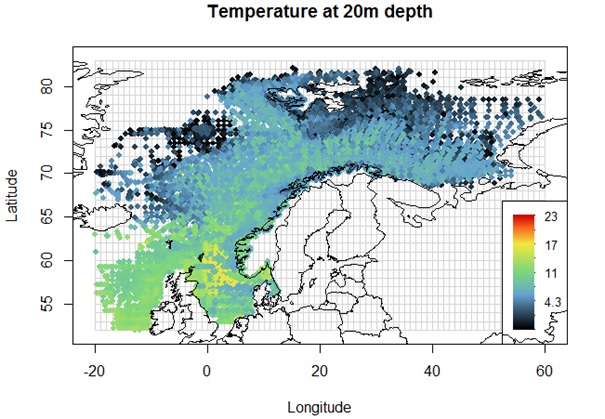
Figure 1. Base map of the whole IMR dataset – Temperature (°C) at 20m depth.
Jupyter Notebook files: RGeostats workshop
Software packages needed:
- Latest Conda package build for RGeostats (build recipe)
- Latest Conda package build for RIntaros (build recipe)
Developer: ARMINES
Analysis of passive acoustic data
This service processes and characterizes passive acoustic data, and produces spectrograms and noise statistics plots that can be used for analysis in combination with time serie s of satellite remote sensing derived parameters. It is implemented using the R version of the open source PAMGuide software package, and has extended s upport for new data formats (NetCDF) and data access through the OPeNDAP protocol.
The service has been tested with datasets from several sources (NERSC, CNRS, PANGAEA). Figure 2 shows an example of passive acoustic collected by CNRS in Kongsfjorden, Svalbard, as part of the INTA ROS field campaigns. The spectrum is dominated by low-frequency noise below 10 Hz. Local peaks around 10 Hz and 80 Hz are also seen, which could be mammal vocalization. Intermit tent broad-band signals are also seen in the spectrogram. Read more about the passive acoustic service in INTAROS Deliverable D5.7.
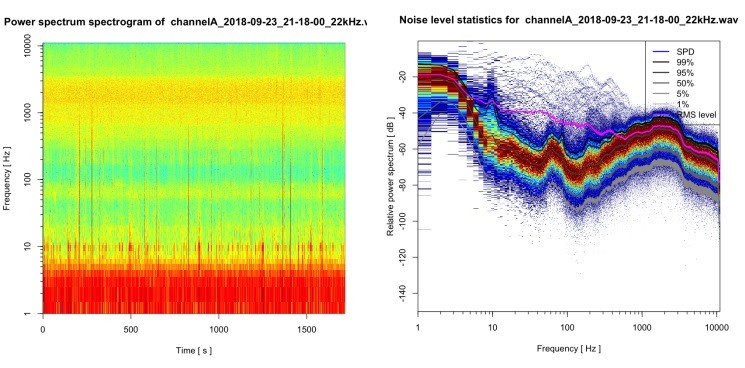
Figure 2. Examples of power spectrum spectrogram (left) and noise statistics plot (right) generated by the passive acoustic service when analysing acoustic data collected in Kon gsfjorden, Svalbard, during the INTAROS project.
Jupyter Notebook files: PAMGuide-R-Tutorial
Software packages needed:
Developer: NERSC
Sea ice concentration statistics
This service generates monthly sea ice statistics for the Svalbard region using daily sea ice concentration (SIC) charts from the Copernicus Marine Environment Monitoring Service (CMEMS). The CMEMS SIC products are based on several types of satellite imagery, including Sentinel-1 SAR, and are provided by the Norwegian Meteorological Institute through an OPeNDAP data server. The resulting monthly statistics is stored in a NetCDF file, and a small sized plot of the mean sea ice concentration is provided as a PNG file for easy visualisation. Figure 3 shows a few examples of monthly SIC fields generated by this service. Read more about the sea ice concentration statistics service in INTAROS Deliverable D5.7.
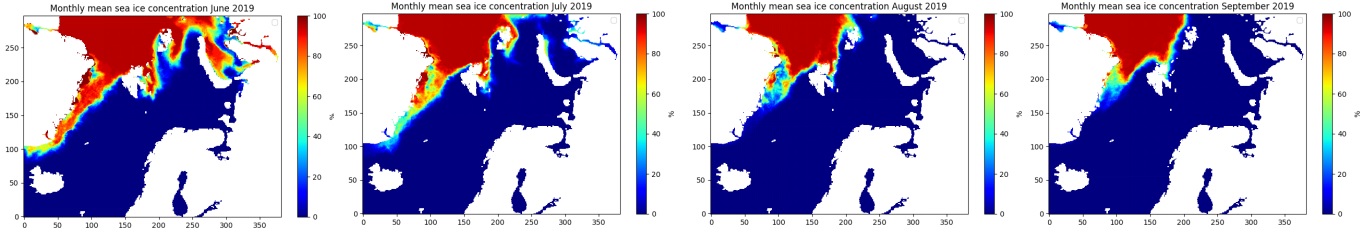
Figure 3. Examples of sea ice concentration statistics, monthly means for June - September 2019 in the Fram Strait of area north of Svalbard, generated from daily CMEMS products.
Jupyter Notebook files: Sea ice concentration statistics
Software packages needed:
Developer: NERSC